The S&P 500 peaked for the session at 9:33 on Monday morning. Yes, that’s three minutes after the opening bell. By 09:48, our equity market’s broadest large-cap index was down for the day. There were three, or you might say, four attempts to rally the stock market after that. Each met resistance at Friday night’s closing level for the S&P 500 and that was that. After lunchtime in New York, the pressure to reduce exposure to U.S. stocks only accelerated, while yet again investors found safety in U.S. Treasury debt securities. Traders also poured into precious metals, such as gold and silver in their search for safe haven.
One place traders and investors did not move capital toward was bitcoin. Professional traders used Pres. Trump’s social media posts in regard to the establishment of a cryptocurrency reserve as an opportunity to reduce exposure at improved prices. In an absolute whirlwind of activity, bitcoin came off of a low of $78,400 per token on Friday to trade above $94,000 on Sunday and back down into the mid-$80,000s on Monday. I have seen bitcoin trade with an $83,000 handle, as the creatures of the night hunt one another this morning. Bitcoin is already a rough 22% off of its high price for 2025, but still up about 56% since early September.
Reality Strikes?
On Monday morning, the Institute for Supply Management published the results of its February manufacturing survey of purchasing managers. The headline number crossed the tape at 50.3, which is still (just barely) in expansionary territory, but was down from January’s 50.9 and below the 50.6 that Wall Street was looking for.
Stay with me here, because once you open up this report and take a gander at the components that make up that “expansionary” number, you may get sick to your stomach. New orders, by far and away, the single most important component of any business survey of any kind, printed in “contractionary” territory at 48.6, down from a quite decent looking 55.1 for January. Employment dropped from 50.3 in January to a fairly terrifying (for economists) 47.6. Customer inventories, and “backlog of orders” also printed in the hole.

You know what the hottest component of this survey was? That’s right… prices. That number hit the tape at 62.4, up from 54.9. February was the 29th consecutive month of expansion for pricing across the nation for manufacturers. Hence, the headline print for the month hit the tape in a state of expansion only on the strength of accelerating producer level inflation. Just lovely.
Nearly simultaneously, the Census Bureau published that agency’s report for January construction spending. What we learned was that in January, construction spending contracted 0.2% from December, which was down sharply from the 0.5% growth seen November into December and a notch worse than the consensus view for a print of -0.1%.
Run to the Hills
Run to the hills
Run for your life

Run to the hills
Run for your life
– Stephen Percy Harris (Iron Maiden), 1982
Atlanta Goes Wild!
On the results of that data, the Atlanta Fed revised their GDPNow model for the first quarter down to -2.8% (q/q, SAAR) from the already contractionary -1.5%. Atlanta tweaked its inputs for real personal consumption expenditures and real private fixed investment sharply lower to get there. Atlanta expects to revise this model again on Thursday morning after the Bureau of Economic Analysis publishes its January data for the U.S. trade balance (deficit) and the Census Bureau revises its initial data for January Wholesale Inventories. (For folks who do or did something outside of economics occupationally, q/q, SAAR is economic shorthand for quarter over quarter, seasonally adjusted, annualized rate.)

Bonfire
All of that was just the set-up. What happened next created a bonfire across financial markets. Early Monday afternoon, Pres. Trump confirmed to reporters that 25% tariffs on both Canada and Mexico would land on Tuesday (today). The president also noted that global reciprocal tariffs will go into effect on April 2. This launched an avalanche of keyword-reading, high-speed, high-frequency trading algorithms that took several pounds of flesh out of risk asset valuations.
Those tariffs on imports from U.S. neighbors Canada and Mexico did take effect as the clock ticked from Monday to Tuesday. The U.S. also introduced an extra 10% tariff on Chinese imports. In response, Ottawa rapidly imposed 25% tariffs on $100 billion worth of U.S. exports to that country and Beijing announced new tariffs on U.S. food and agricultural exports to that nation.
It may or may not hurt here for now, but the fact is that as the end consumer with ongoing trade deficits, the U.S. will outlast its trade partners in a trade war and the president understands this. The effort is to try to get U.S. manufacturers to reshore operations and foreign manufacturers to build here. A gamble, but one that would almost certainly help reestablish the middle class if successful. If not successful, better trade terms for the U.S. at a minimum, should not be too difficult to accomplish.
The Point of Sale
Remember the Friday rally? Remember how we thought aloud that perhaps that was simply “end of month” activity? Though technically that day presented as a potential “day one” of a bullish turn for stocks, Monday made us think other thoughts.
On Monday, losers beat winners by a rough 7 to 3 at the New York Stock Exchange and by about 7 to 2 at the Nasdaq. Advancing volume took just a 20.3% share of composite NYSE-listed trade and a 22.9% share of composite Nasdaq-listed activity. The one bright spot, though it probably did not help your profit / loss ratio in real-time was the day over day contraction in aggregate trade. Volume contracted by 12.9% on a day over day basis across NYSE-listings and by 0.9% d/d across Nasdaq-listings.
The blood was on the floor, and very few escaped on Monday. The S&P 500 gave up 1.76% while the Nasdaq Composite suffered a beating of 2.64%. The Dow Transports were slapped around for a loss of 1.78% while all of our small to mid-cap equity indices gave back between 2.25% and 2.81%.
Here’s the rub. Four of the 11 S&P sector SPDR ETFs ended Monday higher for the session. All four of those were sectors that we consider to be defensive in nature led by the REITs (XLRE) and the Staples (XLP) . Two of these funds gave up more than 3% on the day: Energy (XLE) and Technology (XLK) . I told you that I used Friday’s pop to cut my long position in Nvidia (NVDA) . I reacted to the Atlanta GDP revision by cutting exposure to energy and the U.S. consumer. We are still rebuilding our long positions across the defense contractors. It’s key to note that the Philadelphia Semiconductor Index, which was down another 4% on Monday, is now down 13.8% just since Feb. 20. I also reduced CrowdStrike (CRWD) , though I love the name, ahead of tonight’s earrings results. CrowdStrike remains a top five holding of mine.
Warning
Note in this daily chart for the S&P 500 that both the open and close and trading range for Monday fully encompass the open and close and trading range from Monday.
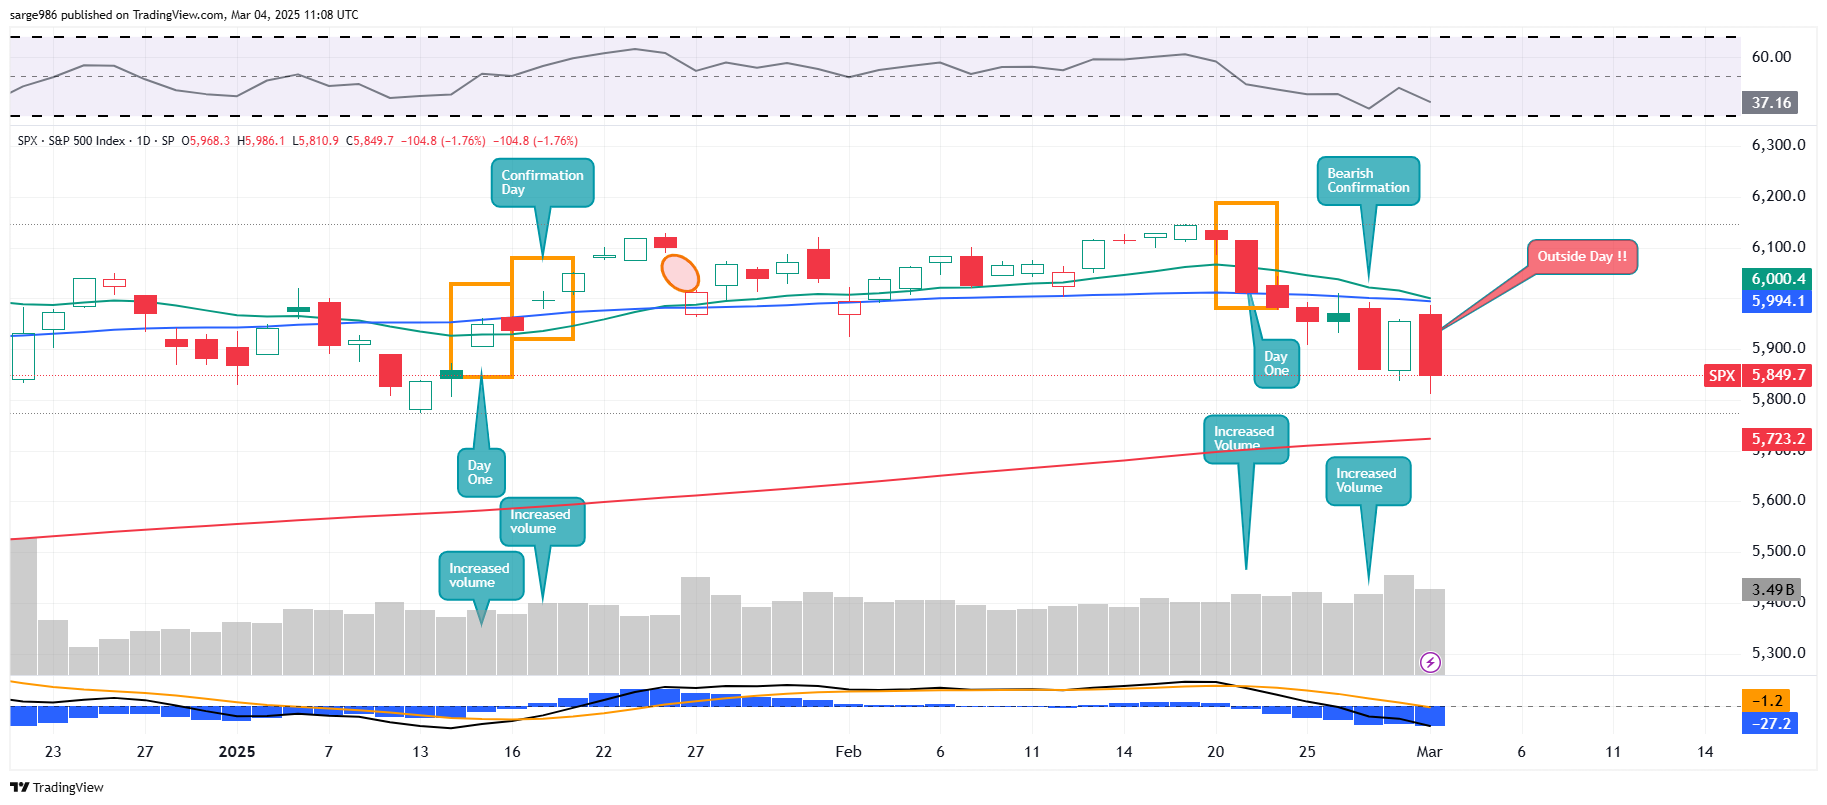
This creates what is known technically as an “outside day.” I won’t waste the space, or your time, but this same “outside day” is evident on the daily chart of the Nasdaq Composite. What an outside day signals is a coming period of increased volatility. Simply put, though markets have been wildly volatile since the middle of February, the start of this trade war is not going to signal the coming end of this wild period. The mayhem, my dear friends, has just begun.
In Case You Live Under a Rock…
The United States ceased all military aid to Ukraine late Monday following last week’s contentious meeting between Presidents Trump and Zelenskyy that included Vice Pres. Vance. The U.S. has provided more than $120 billion in overall aid to Ukraine since the February 2022 Russian invasion including more than $67 billion in direct military aid.
Overnight, in response to this U.S. action, European Commission Pres. Ursula von der Leyen revealed that she is offering the nations of the European Union an urgent plan to encourage them to quickly ramp up defense spending. Globally, defense and aerospace stocks are trading higher. My portfolio’s top performing stocks overnight have been RTX (RTX) and Lockheed Martin (LMT) with both Kratos Defense & Security (KTOS) and General Dynamics (GD) rounding out my top five.
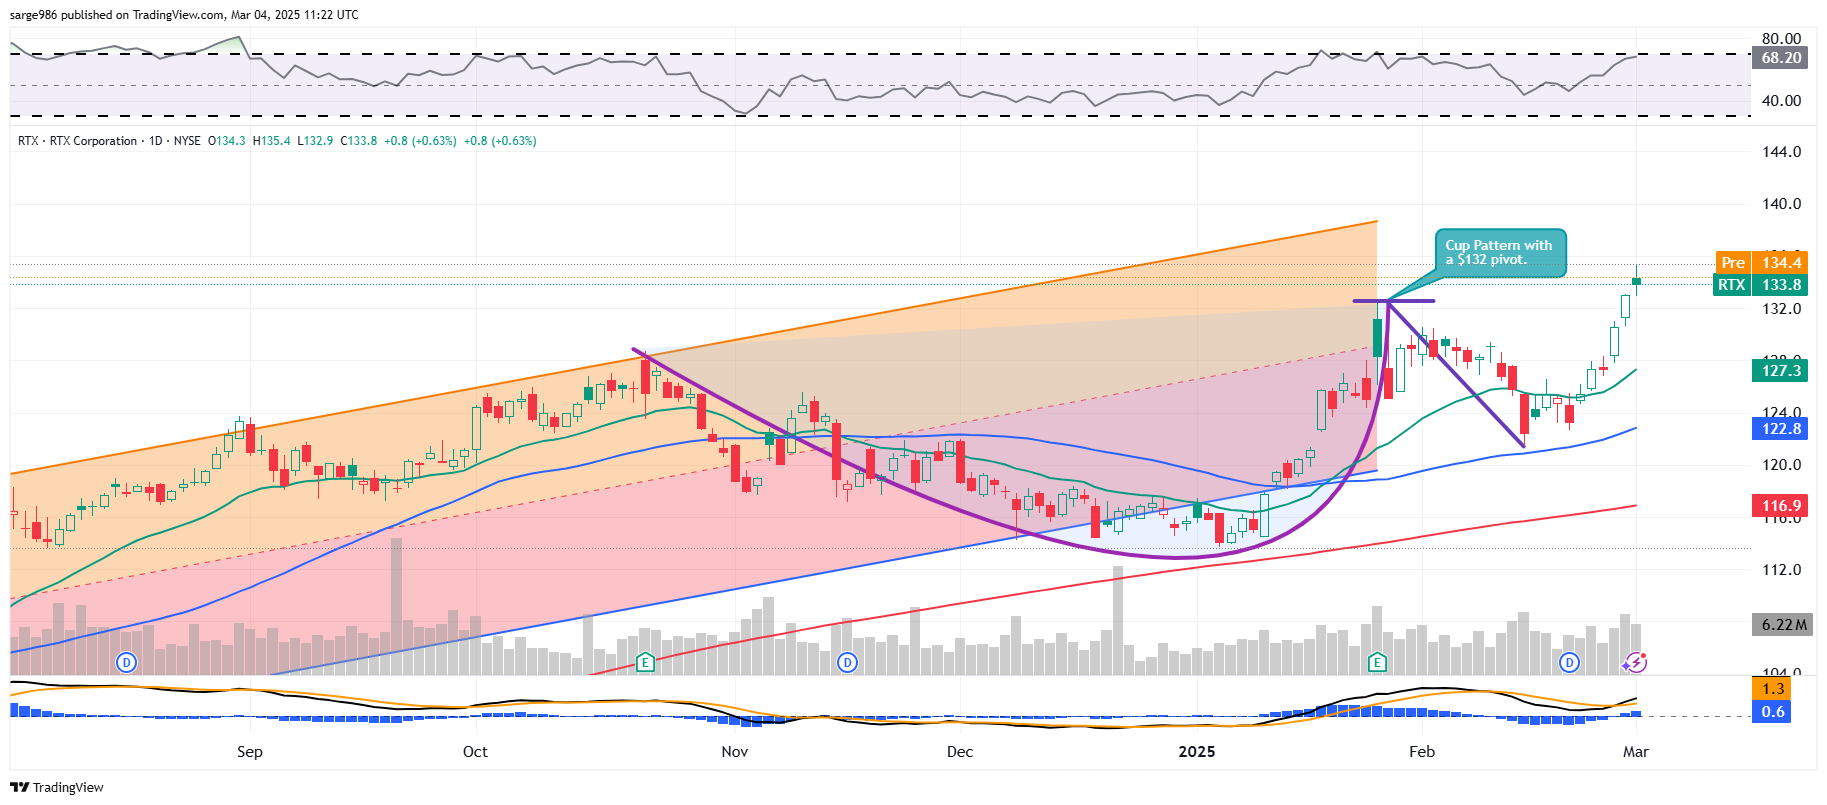
Note that RTX, the old Raytheon Technologies, is currently breaking out from a cup-with-handle pattern with a $132 pivot. My current target price is $158. The Wall Street consensus target for this name is about $144. I believe that I have the second-highest target on RTX among highly traded Wall Street analysts, only behind Robert Stallard of Vertical Research. Stallard’s target is $159.
Economics (All Times Eastern)
08:55 – Redbook (Weekly): Last 6.2% y/y.
4:30 p.m. – API Oil Inventories (Weekly): Last -640K.
The Fed (All Times Eastern)
2:20 – Speaker: New York Fed Pres. John Williams.
Today’s Earnings Highlights (Consensus EPS Expectations)
Before the Open: AZO (29.21), BBY (2.41), ONON (.18), TGT (2.25)
After the Close: AVAV (.66), BOX (.42), CRWD (.86), JWN (.93), ROST (1.66)
At the time of publication, Guilfoyle was long CRWD, NVDA, RTX, LMT, KTOS, GD equity. equity.
